 Spline
How to Create 3D Data Visualizations in Spline Using Variables and Real-Time APIs
Spline 3DAdvanced15 min
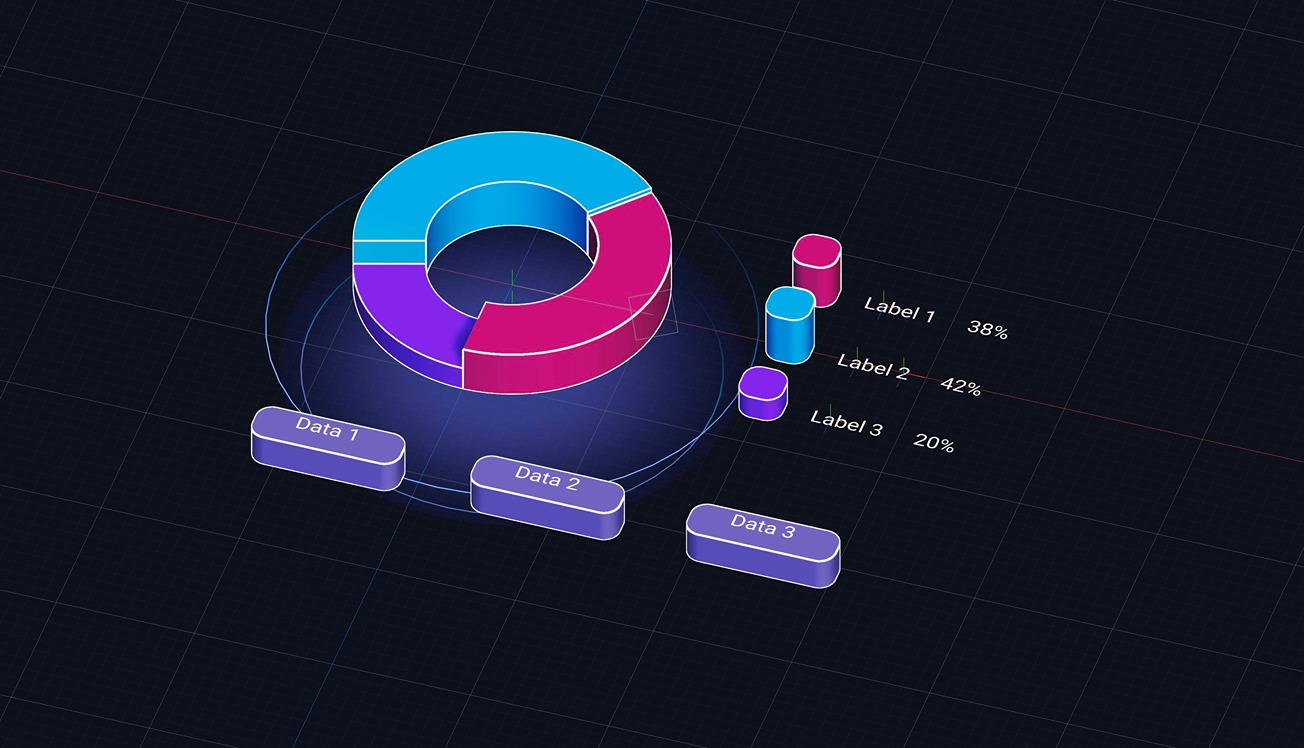
Today, we’re exploring how to turn data into real-time, interactive 3D visualizations using Spline. You'll learn how to build dynamic chart experiences that can be embedded directly into your brand’s website. We'll also show you how to use variables and connect APIs to make your visuals respond to live data, unlocking new ways to enhance your branding, marketing assets, and data dashboards.
Learn more about variables: https://youtu.be/Id_SZVCUVMM?si=0flq5uPWLAH_frVR